
Today, we are announcing the release of the Social Media Index (SMI), the first global real-time indicator that shows the impact of social media on online news consumption. The SMI is based on data compiled by Echobox, which we make available to journalists and academics, as well as the general public.
Over the past three years, news publishers from around the world have been delegating their number-crunching to our algorithms. These are trained on more data than any human could feasibly analyse. In the words of Le Monde journalist Michaël Szadkowski, using artificial intelligence is a “win-win” because the newsroom can focus on reporting the news while Echobox supports them in curating their social media presence by turning data into actionable insights.
In the coming months, we are going to share with you a broad array of indicators and data visualisations, updated in real time and free to use. This is data about all of us and about our world, and we are passionate about making it available to everyone online.
What is social media’s impact on the media industry?
There is a lot of debate about the role and importance of social media, with issues ranging from fake news to privacy. The first data series we are releasing focuses on the topic of social media and the media.
Our Social Media Index shows the percentage of traffic the online publishing industry receives from social media every single day. It is the first index of its kind, making it possible for anyone to easily identify trends, spot spikes and find patterns in social-media generated traffic, and in many cases even identify their cause — whether it is a Facebook algorithm update, an epic celebrity scandal or a tragic bout of violence.
The results can be surprising. On the day of the US presidential election — probably the most closely watched event of last year — social media did not play an outsize role in generating traffic to news websites. It was only in the days that followed that social traffic spiked, as people around the world took to Facebook to share, find and discuss the news. (Twitter tends to react more quickly to major news events, but one of the most obvious points is that Facebook completely dominates social traffic, as we have reported before.)
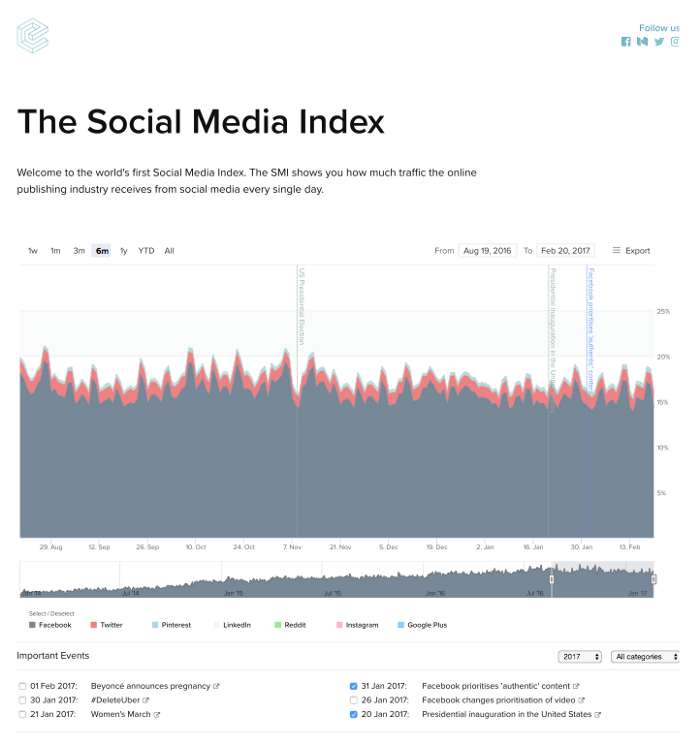
We will be publishing regular articles on what we think are the key results emerging from this data, but we have also made it easy for you to do your own analysis. You can add over 100 events to the chart, zoom out to a three-year view or into a single day, look at all social networks or just Pinterest (well worth a look) and even download the data.
Anyone is permitted to use this data for personal, commercial or academic purposes. All we ask for is that you mention Echobox with a link back to either the SMI or our main website and/or add our logo (dark, bright, transparent dark or transparent bright).

We hope you will find this data as useful and fascinating as we do, and we hope that it will inspire passionate debate, thoughtful discussion and data-driven analysis for our time. Let us know what you think — and what you would like to see next.


