
This is a guest post from content intelligence platform for publishers, Chartbeat. It is part 2 of our latest 2-part collaboration. For a more detailed look at recent social media patterns, please read our companion piece on the Chartbeat blog.
When Chartbeat and Echobox last partnered, we combined our expertise to analyze the state of social media and search in the midst of the Coronavirus pandemic. As both referral sources continue to factor heavily in audience engagement strategies, we’re diving back in to see what’s changed since then and offer insights on using this data to inform audience development moving forward.
Traffic has returned to pre-pandemic levels
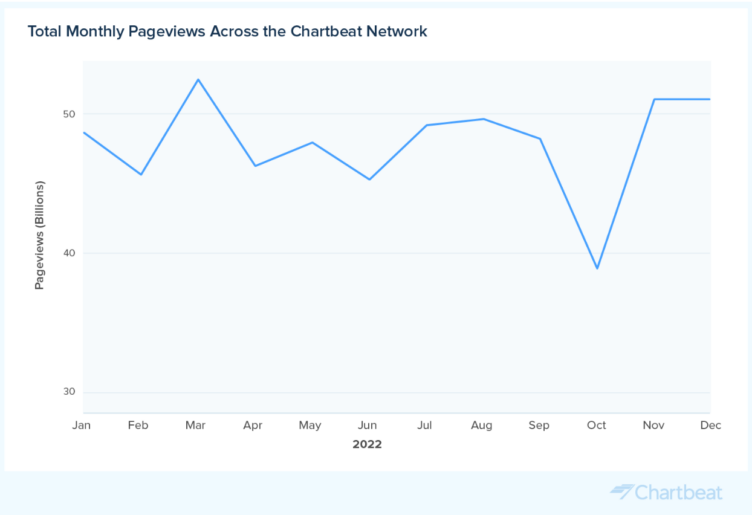
In 2020, publishers saw an unprecedented bump in traffic and engagement related to COVID-19 with average monthly pageviews increasing 22% from the year before. Over the course of 2021, publishers retained some of these new readers, but monthly traffic started trending back towards pre-pandemic levels. In 2022, average monthly pageviews fell 13% from the previous year, landing nearly level with 2019’s traffic numbers.
Looking closer at 2022 itself, pageviews across the Chartbeat network peaked at the beginning of March as the world turned its attention from COVID-19 to the war in Ukraine. Despite this bump and a dip in the fourth quarter, overall traffic finished roughly where it started the year.
While most regions followed the global trend, it’s worth noting that the Middle East was the only subregion to experience sustained year-over-year increases in traffic besides North America and Latin America during popular regional events like midterm elections and the World Cup.
Engagement gradually declines throughout the year
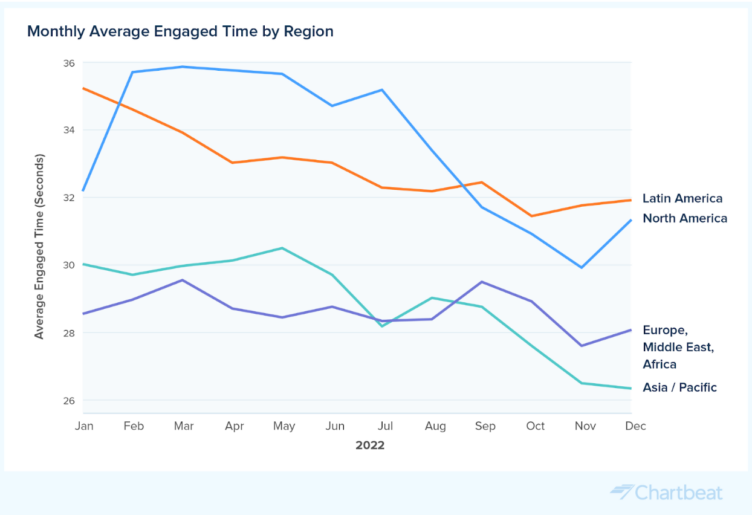
The increase in pageviews near the end of February also resulted in an increase in Average Engaged Time (AET). Outside of this period, however, AET across the world declined throughout 2022, dropping 6.9% (2.15 seconds) from Q1 to the end of Q4. This follows the trend of gradually decreasing engagement throughout the year that we saw in 2019 and 2021.
Comparing the Search and Social giants
Chartbeat’s data from our global network of publishers provides helpful insights for comparing the largest social referrer, Facebook, to the largest search referrer, Google Search. Let’s take a closer look at a few of the trends:
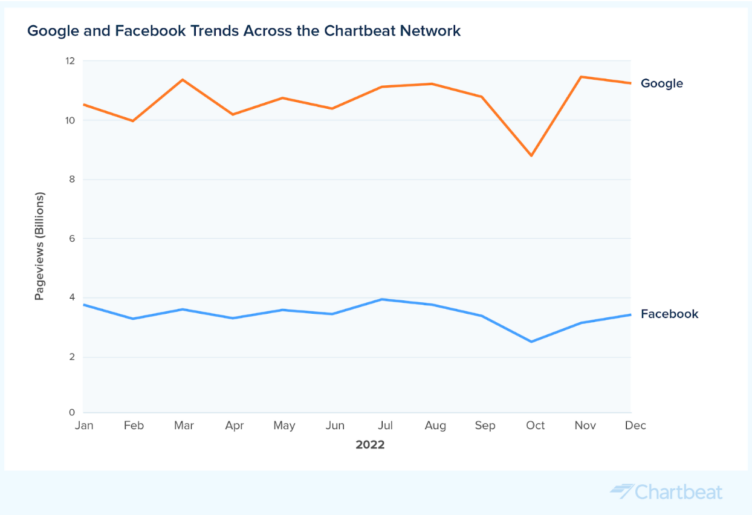
1) Search continues to be the largest external source of traffic, with Google in particular driving referrals.
2) Over the course of the year, Facebook traffic fell nearly 9% while referrals from Google Search increased 7%. Even so, Facebook continues to drive more than 1.5x the volume of traffic when compared to other referral sources.
3) At the end of 2022, Facebook traffic driven by links in posts was around 3.4 billion pageviews per month, down from 3.8 billion in January. While link-focused posts may be driving less traffic, engagement with video content on the platform itself is rising.
4) Average Engaged Time across both Google and Facebook was above the network-wide average of 30.6 seconds. Readers engaged with content referred by Facebook for 34.5 seconds compared to 40.4 seconds from Google Search. For both Facebook and Google, the highest monthly AET occurred in March 2022 and the lowest monthly AET occurred in November.
Referrer trends across the Chartbeat network
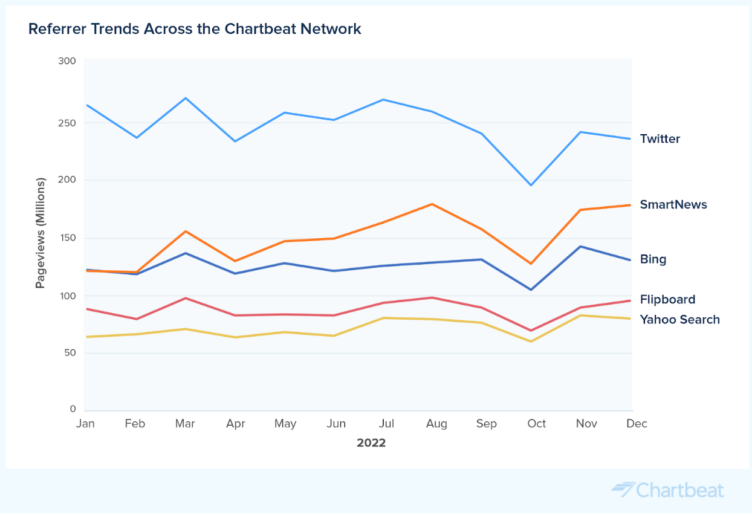
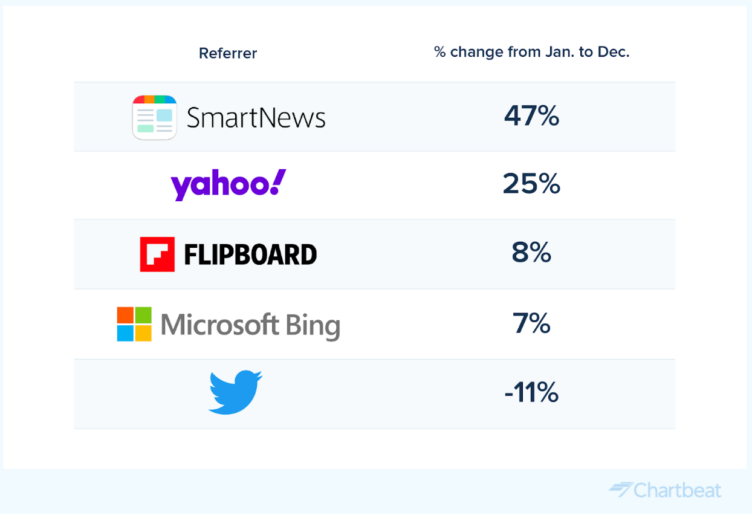
Though Facebook and Google Search dominate as sources of referral traffic from social and search respectively, we also looked at the data for trends from other referrers as well. In doing so, we saw an uptick in referrals from other search engines and aggregators, as the chart above shows.
1) With the exception of Twitter, down 11%, all other major referral sources saw an increase in referrals in 2022.
2) SmartNews saw the largest increase (47%) during this period.
3) Yahoo Search also saw a sizable increase in pageviews, growing 25% between January and December.
Our takeaways
Here are a few takeaways for publishers from our audience trends analysis:
1) Google and Facebook continue to dominate as the top search and social referrers.
Over the course of the year, pageviews from Google Search increased 7% while Facebook traffic fell nearly 9%. Google and Facebook have been by far the largest sources of traffic for a number of years, and it’s a trend we don’t expect to change in 2023.
2) Traffic from major social networks declined over the course of 2022.
In addition to Facebook, Twitter also saw a decrease in referral traffic to publishers in 2022. By comparison, aggregators and search engines like SmartNews and Yahoo increased their smaller shares of social referrals. These trends can help you set the right strategy and success metrics for each platform. For example, as audiences engage more with video content on social media, it opens up new opportunities to connect with audiences in innovative ways that go beyond link clicks.
3) Audiences are more engaged earlier in the year.
When we look at engagement in 2022, we see a distinct pattern of higher Average Engaged Time in the first half of the year compared to the second half. This follows the trend that we saw in 2019 and 2021, and demonstrates a clear opportunity for refreshing engagement strategies at the midway point of the year. Start by placing related links at strategic points in your content to increase Recirculation and, where possible, use audience segment data to customize the reader journey for each visitor.
For a more detailed look at recent social media patterns, please read our companion piece on the Chartbeat blog.


